From Presence to Behaviour
A bat detection, acoustic or thermal, tells you that a bat was present at a given place and time. It is a point in space and time, a contact, a record. For many survey purposes this is sufficient: presence data underpins distribution atlases, informs protected species assessments, and triggers conservation obligations.
But presence is only the beginning of the ecological story. What was the bat doing? Was it transiting rapidly through the site, or foraging intensively along a particular feature? Did it follow a linear structure — a hedgerow, a woodland edge, a watercourse — or did it move freely across open ground? Did it return repeatedly to the same area, or was each pass unique?
These are behavioural questions, and acoustic monitoring alone cannot answer them. A bat passing a static detector at 40 km/h leaves the same type of contact as one circling intensively two metres above the microphone. The contact count differs, but the spatial and behavioural context is invisible.
Track analysis transforms bat monitoring from presence/absence into movement ecology.
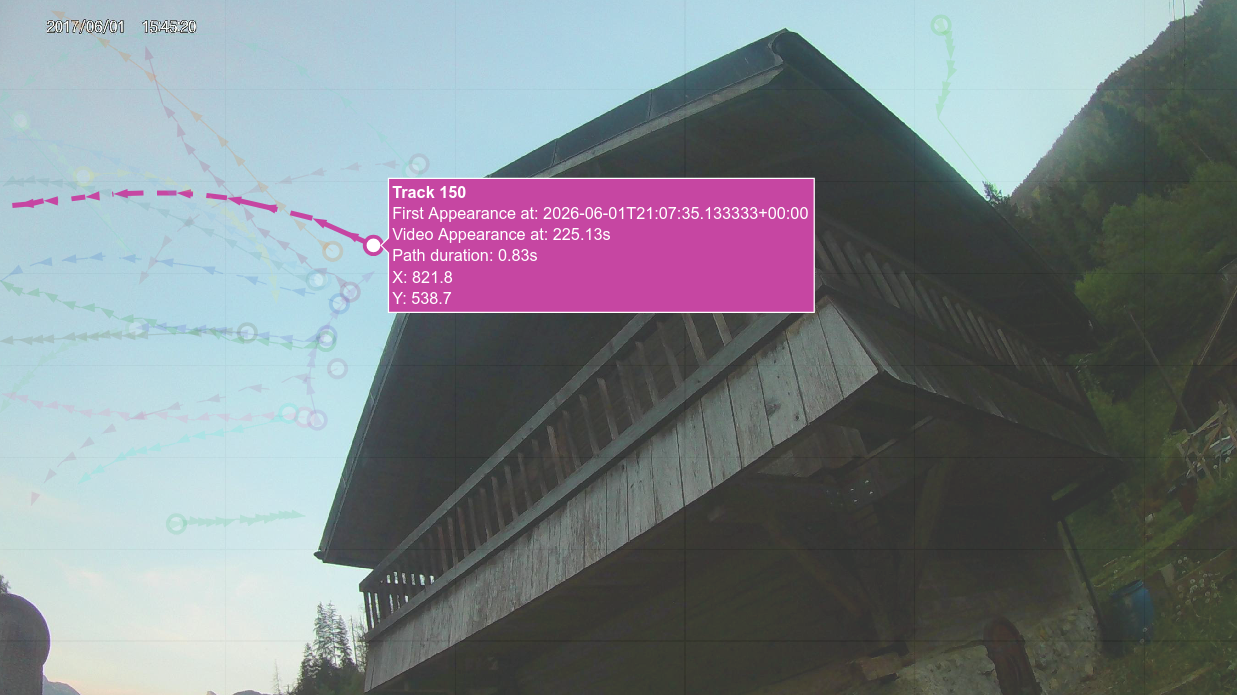
Thermal video, combined with automated tracking, changes this. Every trajectory reconstructed by TrackBats is a movement record: a sequence of positions in space over time, from which speed, direction, curvature, and spatial context can all be derived.
What a Track Contains
Each track produced by TrackBats represents the complete recorded trajectory of one individual bat, from the first frame in which it is detected to the last. For every track, the following information is available:
- Position The x,y coordinates of the bat in each frame: a continuous record of its path through the field of view.
- Speed Derived from frame-to-frame displacement; expressed in pixels per frame or calibrated to real-world units when camera geometry is known.
- Direction The heading at each moment and how it changes: useful for distinguishing directed transit from circling or erratic foraging flight.
- Duration How long the bat was visible — relates to both the size of the field of view and the behaviour of the individual.
- Entry / Exit Where the bat entered and left the frame — can be mapped to landscape features at the edges of the scene.
- Timestamp The exact time of each detection, enabling temporal analysis of activity patterns within a session.
Filtering and Validation
Not every detection that enters the tracking algorithm represents a bat. Moving vegetation, insects, reflections, and other thermal artefacts can produce spurious tracks, particularly in complex scenes. TrackBats provides tools for reviewing and filtering tracks before export.
Manual validation
The track list can be reviewed in the interface, with each track visualised over the original video. Questionable tracks can be inspected frame by frame and excluded from the export if they do not represent real bat passes. Rather than watching the entire video, the ecologist reviews only the track list, spending time on the subset of detections that require judgement.
Species and status tagging
Validated tracks can be annotated with species identity (where known from concurrent acoustic recording) and behavioural status: transit, foraging, commuting. This produces a structured dataset for downstream analysis and report writing.
Behavioural Interpretation
Track shape and kinematics carry information about bat behaviour that experienced observers have long used qualitatively in the field. Automated tracking makes these observations systematic and quantitative.
Transit
Fast, directed movement with low curvature. Bats moving through the scene on a consistent heading — confirming use of a linear feature as a flight path in corridor analysis.
Foraging
Repeated direction changes, reduced speed, and concentration of activity in a limited area. High curvature and spatial clustering are signatures of active hunting flight.
Commuting
Intermediate speed and moderate directionality: bats moving purposefully but not at full transit speed, often following hedgerows, watercourses, or woodland edges.
These behavioural categories are not always cleanly separable, and their interpretation depends on ecological context. But having quantitative track data — rather than impressionistic field notes — makes it possible to apply consistent criteria across sites and sessions.
Spatial Analysis and GIS Integration
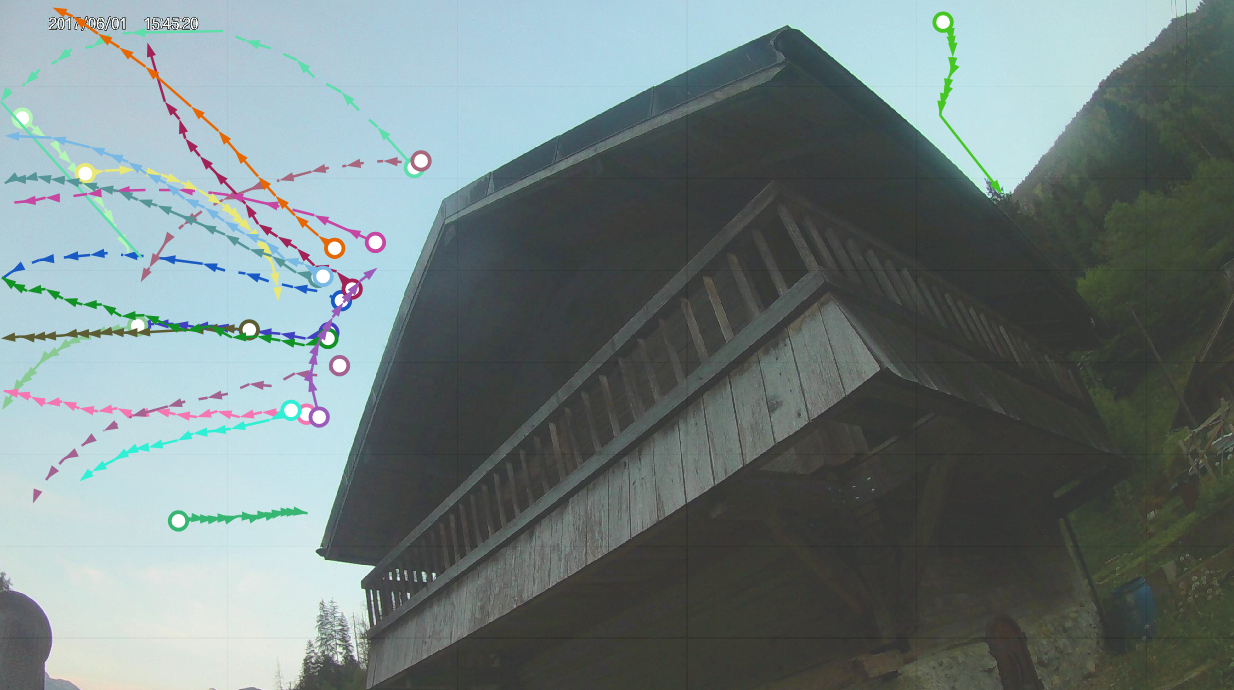
Track data exported from TrackBats can be used directly in geographic information systems in order to be edited and analyzed.
This spatial integration is particularly powerful for impact assessments. Rather than reporting that bats were detected at a site, it becomes possible to show precisely which part of the site they used, at what intensity, and with what directional preference.
Even without full georeferencing, the relative positions of tracks within the frame carry information about which parts of the scene — which exit, which edge, which height band — bats prefer. The spatial export produces GeoPackage format compatible with QGIS, ArcGIS, and any standard GIS environment.
From Individual Tracks to Population Patterns
A single session produces dozens or hundreds of tracks. Across sessions separated by different dates, weather conditions, and seasons, patterns emerge that no single observation could reveal.
Which parts of the scene are used most intensively? Do bats consistently follow the same flight lines, or is use diffuse across the frame? Does activity peak immediately after emergence, or does it build gradually?
The heatmap tool in TrackBats aggregates track data spatially, showing the density of bat presence across the field of view as a continuous surface. This visualisation makes spatial patterns immediately readable to ecologists, clients, and regulators in a way that track lists alone cannot.

Track analysis is not a replacement for ecological expertise. It is a tool that puts richer, more structured, more reproducible data in the hands of the ecologist, so expertise can be applied to interpretation rather than spent on counting and recording.
Continue reading