The Emergence Survey Burden
Bat emergence surveys are the backbone of bat roost assessment. Whether you are conducting a preliminary roost assessment, a full roost characterisation, or post-development monitoring, emergence surveys provide the core data: which species are using the roost, how many individuals, which exit points they use, and how that changes across the season.
The Bat Conservation Trust Guidelines for Bat Work now explicitly recommend night vision aids: thermal imaging cameras in particular: for roost emergence surveys, recognising that the human eye misses a significant proportion of bats after dark. This is the right call ecologically. The consequence, operationally, is that every survey session now generates hours of footage that someone has to review.
For a standard roost characterisation with three emergence surveys across the season, a surveyor might accumulate six to eight hours of thermal video. Reviewing that footage manually: frame by frame, counter in hand: takes roughly as long as the recording itself. On a busy project with multiple roosts, this is where a disproportionate amount of time goes: not in the field, not in the analysis, but in watching empty sky.
TrackBats is built to change that.
What Automated Emergence Analysis Gives You
TrackBats processes thermal infrared video using a deep learning detection model trained specifically on bats. It does not detect motion generically: it detects bats. For each video, it automatically produces:
- Bat count The total number of individuals recorded emerging from the roost, derived from trajectories crossing a user-defined counting line. For roosts with multiple exits, separate counts can be assigned to each exit zone within the same video.
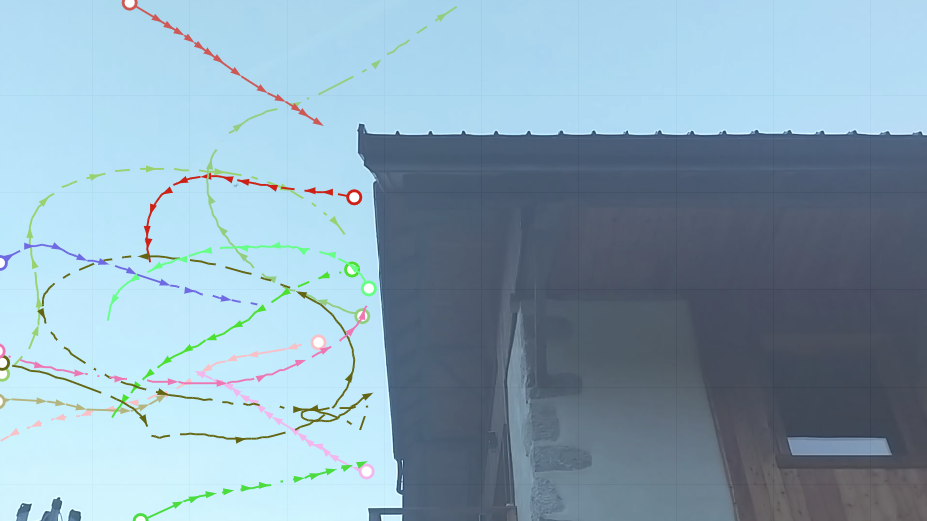
- Highlights video The original footage re-edited to retain only the sequences where bats were detected, with individual tracks overlaid. A two-hour emergence session becomes eight minutes of annotated footage. No scrubbing. No empty sky.
- Full track list Every individual bat trajectory recorded as a timestamped data record, exportable as CSV and GIS-compatible GeoPackage. The complete emergence curve: bats per minute throughout the session: is reconstructable from this data.
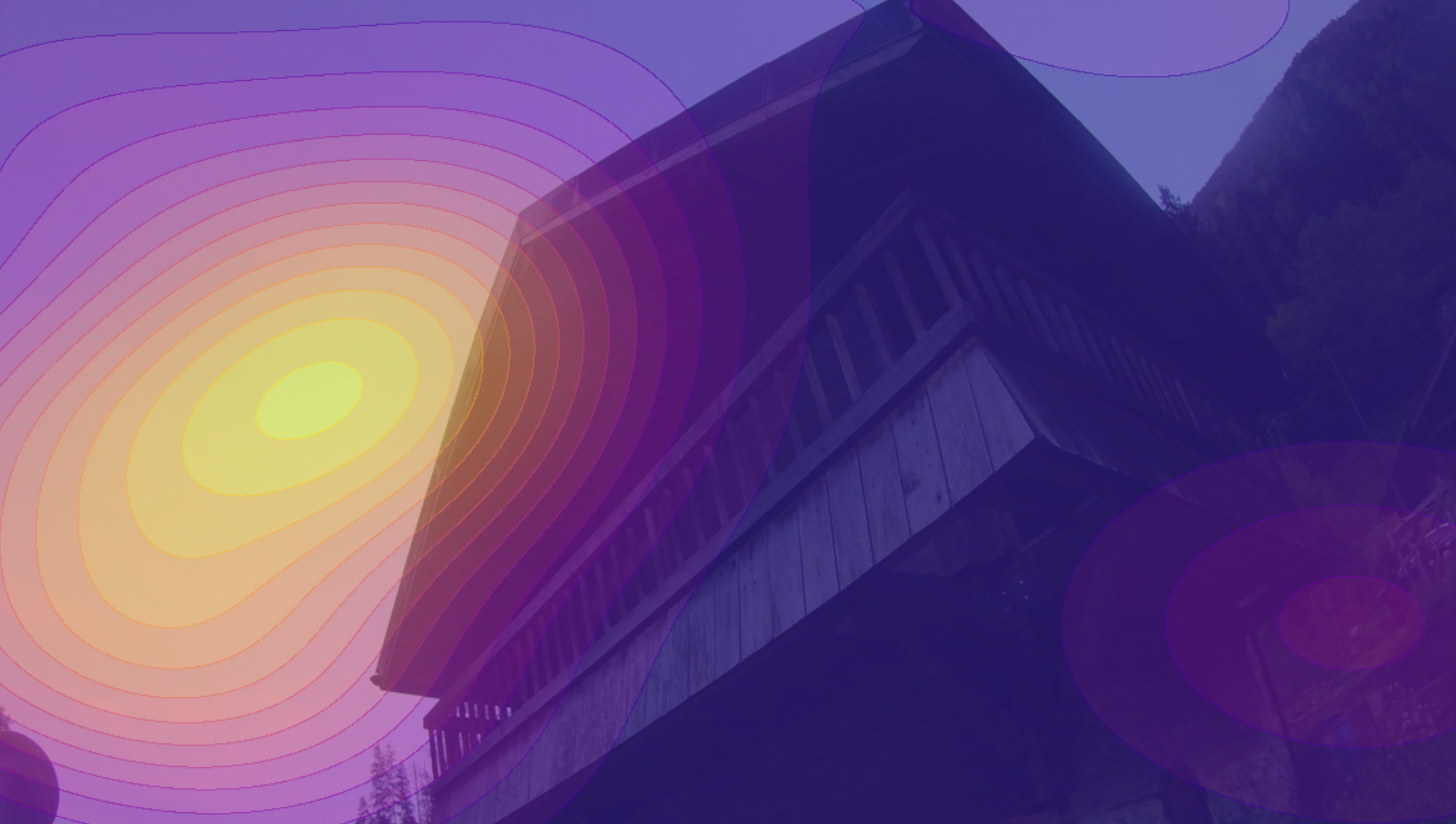
- Heatmap The spatial density of bat activity across the field of view, aggregated across the full session. Exit points, preferred flight lines, and zones of concentrated activity all become immediately visible.
Preliminary Roost Assessment: Finding the Exit Points
One of the most practically useful applications of TrackBats in roost assessment is the preliminary survey stage, where the objective is not yet to count bats precisely, but to understand how the roost is being used: where bats are exiting, at what height, over what duration of the emergence, and from how many distinct exit points.
This information shapes the entire survey design for subsequent visits. A roost with a single, clearly defined exit point requires one observer with one camera. A roost where bats emerge from multiple points across a long facade, at different heights, from features not visible from any single vantage point: this is a different logistical problem entirely, and knowing it in advance saves both time and missed detections.
The heatmap output from even a single TrackBats analysis makes exit point mapping straightforward. Rather than trying to reconstruct from field notes and memory where activity was concentrated during a fast emergence, the spatial density map shows it directly: hotspots of detection density correspond to exit points, and the directionality of tracks at each hotspot indicates whether bats are emerging, returning, or passing through.
For roosts with complex architecture: churches, barns, large modern buildings with multiple elevations: a camera covering each accessible facade, combined with TrackBats analysis, produces a site-wide picture of emergence activity that would require multiple simultaneous observers to achieve manually.
Roost Characterisation Surveys: Counts Across the Season
For full roost characterisation: typically required where a roost has been confirmed and the significance needs to be assessed before a planning decision: emergence surveys are repeated across the season, covering the key phenological windows: spring emergence, peak maternity season, and post-breeding dispersal.
TrackBats handles all three survey types consistently. The same analysis pipeline applies regardless of colony size or emergence behaviour. For large maternity colonies where bats emerge in dense, rapid pulses, the tracking algorithm maintains individual identities across crowded frames. For smaller colonies or low-activity surveys, it recovers bats that intermittent motion would miss entirely.
Across multiple survey dates, the exported track data supports time-series analysis of colony size: plotting emergence counts per session, per month, per year. This is the kind of longitudinal dataset that bat conservation genuinely needs, and that manual counting methods make prohibitively expensive to build.
The Condensed Highlights Video in Roost Assessment
For bat roost assessment specifically, the condensed highlights video has two uses that go beyond simple time saving.
Validation
After any automated analysis, the ecologist needs to be confident the count is right. Rather than re-watching two hours of footage, the highlights video presents every detected bat in sequence, already annotated with its track. Spot-checking for false positives or missed detections takes minutes, not an hour. The ecologist's professional judgement is applied efficiently, to the subset of footage that needs it.
Documentation
Planning applications, roost reports, and licence applications increasingly benefit from video evidence. A condensed, annotated video showing each emergence event is a cleaner and more legible piece of evidence than a raw recording: accessible to planners, clients, and ecologists who were not present at the survey.
Multiple Exit Points: Counting Across a Complex Roost
Many bat roosts, particularly in older buildings, use multiple exit points simultaneously: different tiles, gaps, and openings used by different parts of the colony, or by the same individuals on different nights depending on temperature and conditions.
TrackBats allows multiple counting lines to be defined within the same video frame. Where a single camera can capture two or more exit points simultaneously, each is assigned its own line and counted independently. The track list records which line each individual crossed, giving a breakdown of emergence by exit that would require simultaneous observers to achieve manually.
Where the building requires multiple cameras on different elevations, each video is analysed separately. The results are then combined: either manually or via the CSV exports: to give a site-wide emergence count. The heatmap from each camera position contributes to a composite picture of roost usage across the full structure.
From Count to Report
Once the analysis completes, TrackBats generates a pre-built Word document (.docx) containing the core materials from the survey session: the bat count, the emergence curve, the heatmap, screenshots of individual tracks, and the condensed highlights video reference. This is not a finished report: it is a structured evidence package that drops directly into the appendix of a roost assessment report, or serves as the starting point for the main body.
For ecological consultancies working under time pressure between survey and submission, this matters. The materials that would otherwise take an hour to compile and format: exporting images, resizing the heatmap, finding the right frame from the highlights video for a figure: arrive ready to use. The ecologist's time goes into interpretation and professional judgement, not into document assembly.
The full data exports remain available alongside the report document: the CSV track list for any additional analysis, the GeoPackage for GIS integration, and the condensed highlights video for client delivery or planning submission. The complete output of a TrackBats emergence analysis: count, curve, spatial summary, annotated video, evidence document: is available as soon as the upload finishes processing.
Setting Up for a Roost Emergence Survey with TrackBats
The quality of the automated analysis depends directly on the quality of the recording. A few principles are worth building into standard survey methodology:
Fix the camera on a tripod
Any camera movement creates false detections: the background shifts between frames and the model interprets it as bat movement. A stable mount, even a simple one, eliminates this almost entirely.
Aim for open sky as background
Bats register clearly as warm objects against a cold, uniform sky. Where the roost architecture forces a more complex background, the analysis still works, but a clean sky background gives the cleanest detections.
Frame generously around the exit
Leave enough space so that each bat has a visible trajectory before and after crossing the exit zone. This improves both detection confidence and the quality of the track data.
Record at 25 Hz or above
Most current thermal cameras support 25 or 50 Hz. The faster the emergence, the more framerates matter: dense pulses at lower framerates produce merged or missed detections.
For roosts with multiple exits, note which camera covers which elevation and exit feature before analysis, so that counting lines can be placed accurately.
Continue reading